
AdBreakers Reporting vs EcomXray
Two Shopify apps, side by side: detected stores, momentum, reviews, plans, listed features and who runs each. Store counts as of Jul 3, 2026 for AdBreakers Reporting, Oct 13, 2026 for EcomXray.
The short answer
- Only EcomXray lists a free plan.
- EcomXray lists 1 features AdBreakers Reporting’s listing doesn’t mention, including Historical analysis.
Head to head


Free
- · 30-day restock recommendations
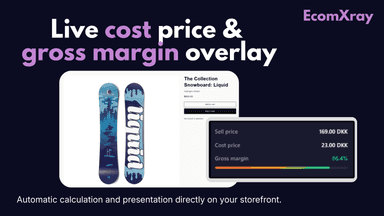
- · Cost price and gross margin
- · Net units sold: 30 / 90 / 365 days
- · Product analytics inside Shopify
- · Revenue rank for top products
Pro
- · 14-day free trial
- · Chrome extension: stock value + editing
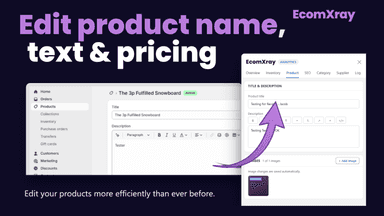
- · Edit product name, description and price
- · Everything in Free
- · Full product activity log
- · Publish to channels, manage collections
Coverage counts what each App Store listing names. Every feature, checked off app by app, is in Shoplist.
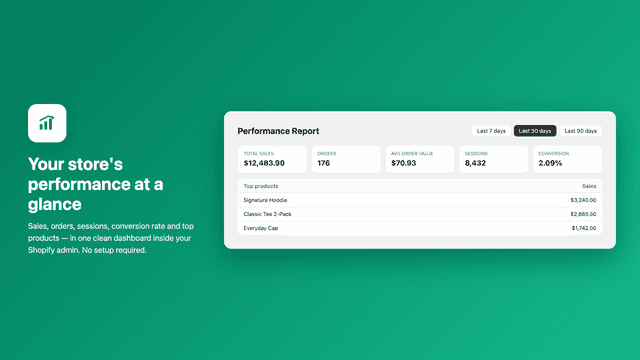
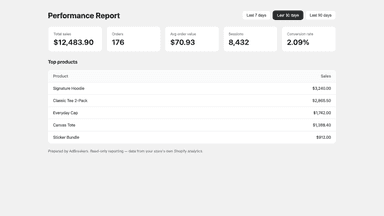
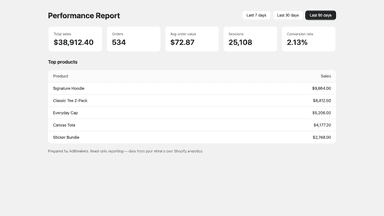
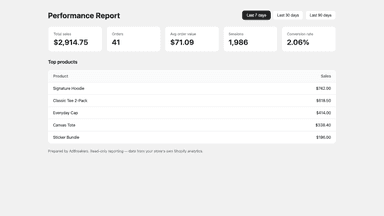
See every featureAdBreakers Reporting shows a clear performance snapshot of your store without any setup. Open the app to see total sales, orders, average order value, sessions, and conversion rate for the last 7, 30, or 90 days, plus your top products by revenue. The report uses Shopify's own analytics data, so the numbers match your admin reports. Nothing is added to your storefront or theme — install and your report is ready.
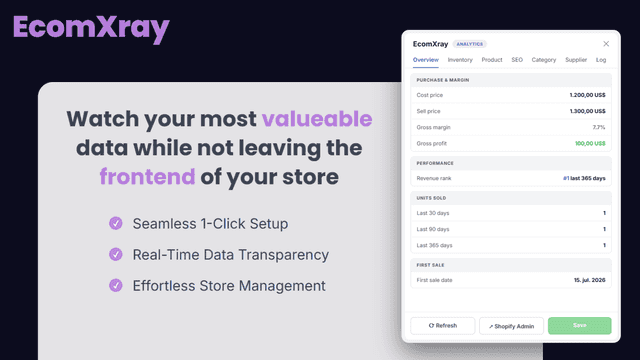
EcomXray puts the product numbers Shopify doesn't surface in one panel. Pick any product and see its cost price, gross margin, current stock, and net units sold for the last 30/90/365 days — refunds, cancellations and test orders excluded. A restock recommendation based on your real 30-day sales velocity tells you what to reorder and when.
- Sales, orders, AOV, sessions and conversion rate in one dashboard
- One-click 7, 30 and 90 day reporting ranges
- Top products ranked by revenue
- Net units sold for the last 30, 90 and 365 days — refunds excluded
- Gross margin calculated from your real Shopify cost prices
- Restock recommendations from your actual 30-day sales velocity
- Edit titles, descriptions and product details without leaving the page

All the numbers
Every figure, side by side
A green dot marks the app ahead on a measured figure. Estimates, gaps and apps that leave no storefront trace never take the lead.
Adoption
| Measure |  AdBreakers Reporting |  EcomXray |
|---|---|---|
| Detected stores | Not published | Not published |
| Net store change, 28 days | 0 | 0 |
| Stores added, 28 days | Not enough data | Not enough data |
| Big-brand share | Not enough data | Not enough data |
| Top store categories | Not published | Not published |
| Top store countries | Not published | Not published |
Reviews
| Measure | AdBreakers Reporting | EcomXray |
|---|---|---|
| App Store rating | Not published | Not published |
| App Store reviews | Not published | Not published |
| New reviews, 28 days | Not enough data | Not enough data |
| Reviewers a year or more in | Not enough data | Not enough data |
Pricing
| Measure | AdBreakers Reporting | EcomXray |
|---|---|---|
| Free plan | Not listed | Yes |
| Lowest paid monthly plan | No monthly plan listed | $29/month |
| Longest free trial | Not listed | 14 days |
| Plans listed | Not published | 2 |
Listing
| Measure | AdBreakers Reporting | EcomXray |
|---|---|---|
| Shopify category rank | #243(ahead) | #1161 |
| Shopify App Charts | Not on this week’s charts | Not on this week’s charts |
| Built for Shopify | No | No |
| Launched | Jul 3, 2026 | Jul 20, 2026 |
| Languages | 1 | 1 |
| Developer | AdBreakers | aMemory ApS |
FAQ
AdBreakers Reporting and EcomXray: common questions
- Is AdBreakers Reporting or EcomXray cheaper?
- Only EcomXray lists a free plan. Shoplist compares base prices only between monthly plans in the same currency; usage charges and annual plans vary, so check each plan’s limits.
- What features does each app list that the other doesn’t?
- EcomXray lists 1 the others don’t mention, such as Historical analysis. A feature missing from a listing may still be supported; this compares what each App Store listing says.
- Where does this comparison’s data come from?
- Shoplist crawls Shopify storefronts to detect which apps each store runs, and reads each app’s Shopify App Store listing for reviews, pricing, features and integrations. Store counts are as of Jul 3, 2026 for AdBreakers Reporting, Oct 13, 2026 for EcomXray; estimated figures are labeled.
How Shoplist compares apps
Store counts come from Shoplist’s crawl of Shopify storefronts, which detects the apps each store runs; they are as of Jul 3, 2026 for AdBreakers Reporting, Oct 13, 2026 for EcomXray. Reviews, ratings, plans, features and integrations come from each app’s Shopify App Store listing. 28-day figures are labeled when estimated, and a figure that is missing or estimated never decides who leads. Read the methodology.