AdBreakers Reporting vs ClearMargin
Two Shopify apps, side by side: detected stores, momentum, reviews, plans, listed features and who runs each. Store counts as of Jul 3, 2026 for AdBreakers Reporting, Oct 13, 2026 for ClearMargin.
The short answer
- AdBreakers Reporting and ClearMargin list the same 1 features.
Head to head


ClearMargin Pro
Coverage counts what each App Store listing names. Every feature, checked off app by app, is in Shoplist.
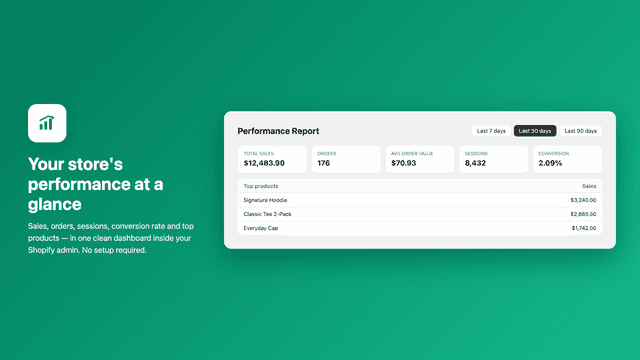
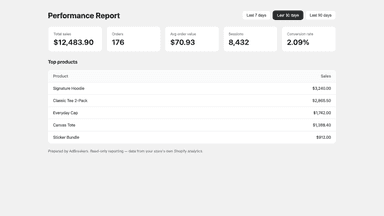
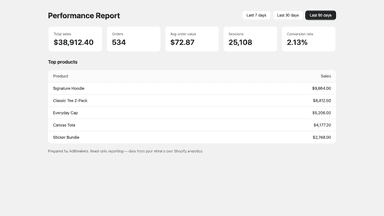
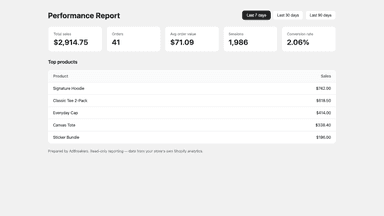
See every featureAdBreakers Reporting shows a clear performance snapshot of your store without any setup. Open the app to see total sales, orders, average order value, sessions, and conversion rate for the last 7, 30, or 90 days, plus your top products by revenue. The report uses Shopify's own analytics data, so the numbers match your admin reports. Nothing is added to your storefront or theme — install and your report is ready.
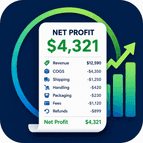
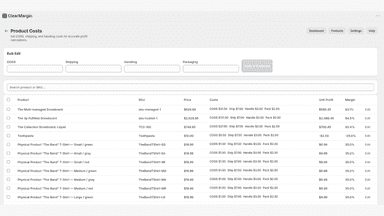
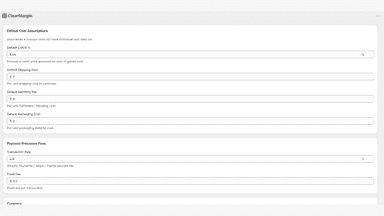
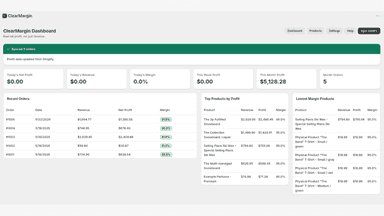
ClearMargin calculates net profit for every Shopify order by deducting cost of goods sold, shipping, handling, packaging, payment processor fees, and refunds. Set costs per product variant or use store-wide defaults. Sync your last 90 days of orders in one click and view profit by day, week, month, and product.
- Sales, orders, AOV, sessions and conversion rate in one dashboard
- One-click 7, 30 and 90 day reporting ranges
- Top products ranked by revenue
- True net profit per order after all costs, fees, and refunds
- Per-product and per-variant cost tracking for accurate margins
- Dashboard with today, week, and month profit metrics
- Automatic payment processor fee calculation

All the numbers
Every figure, side by side
A green dot marks the app ahead on a measured figure. Estimates, gaps and apps that leave no storefront trace never take the lead.
Adoption
| Measure |  AdBreakers Reporting |  ClearMargin |
|---|---|---|
| Detected stores | Not published | Not published |
| Net store change, 28 days | 0 | 0 |
| Stores added, 28 days | Not enough data | Not enough data |
| Big-brand share | Not enough data | Not enough data |
| Top store categories | Not published | Not published |
| Top store countries | Not published | Not published |
Reviews
| Measure | AdBreakers Reporting | ClearMargin |
|---|---|---|
| App Store rating | Not published | Not published |
| App Store reviews | Not published | Not published |
| New reviews, 28 days | Not enough data | Not enough data |
| Reviewers a year or more in | Not enough data | Not enough data |
Pricing
| Measure | AdBreakers Reporting | ClearMargin |
|---|---|---|
| Free plan | Not listed | Not listed |
| Lowest paid monthly plan | No monthly plan listed | $19/month |
| Longest free trial | Not listed | 7 days |
| Plans listed | Not published | 1 |
Listing
| Measure | AdBreakers Reporting | ClearMargin |
|---|---|---|
| Shopify category rank | #249(ahead) | #1190 |
| Shopify App Charts | Not on this week’s charts | Not on this week’s charts |
| Built for Shopify | No | No |
| Launched | Jul 3, 2026 | Jun 1, 2026 |
| Languages | 1 | 1 |
| Developer | AdBreakers | Tregovia |
FAQ
AdBreakers Reporting and ClearMargin: common questions
- Where does this comparison’s data come from?
- Shoplist crawls Shopify storefronts to detect which apps each store runs, and reads each app’s Shopify App Store listing for reviews, pricing, features and integrations. Store counts are as of Jul 3, 2026 for AdBreakers Reporting, Oct 13, 2026 for ClearMargin; estimated figures are labeled.
How Shoplist compares apps
Store counts come from Shoplist’s crawl of Shopify storefronts, which detects the apps each store runs; they are as of Jul 3, 2026 for AdBreakers Reporting, Oct 13, 2026 for ClearMargin. Reviews, ratings, plans, features and integrations come from each app’s Shopify App Store listing. 28-day figures are labeled when estimated, and a figure that is missing or estimated never decides who leads. Read the methodology.