

100 Rocks vs ReportGenix ‑ AI Analytics
Two Shopify apps, side by side: detected stores, momentum, reviews, plans, listed features and who runs each. Store counts as of Oct 13, 2026 for 100 Rocks, Oct 19, 2026 for ReportGenix.
The short answer
- Both list a free plan. Paid plans start at $99/month for 100 Rocks and $19.99/month for ReportGenix.
- ReportGenix lists 8 features 100 Rocks’s listing doesn’t mention, including Custom reports, Data export, GDPR compliance.
Head to head


Momentum
New reviews each month
Review pace is the clearest public read on how fast an app is winning new merchants.
Free
- · 1 lifetime design extraction
- · Basic analytics
- · Up to 3,000 measured sessions/month
Starter
- · 10 design extractions/month
- · Adaptive serving and A/B tests
- · Continued analytics collection
- · Up to 25,000 measured sessions/month
Growth
- · 100 design extractions/month
- · Adaptive serving and A/B tests
- · Continued analytics collection
- · Up to 100,000 measured sessions/month
Scale
- · Adaptive serving and A/B tests
- · Continued analytics collection
- · Unlimited design extractions
- · Up to 1,000,000 measured sessions/month
Free Plan
- · Access to 100+ reports
- · Customizable dashboard layouts
- · Duration 90 days
- · Filter & group data
- · Interactive charts and graphs
- · Multicurrency reporting.
Basic Plan
- · Custom report Up to 10
- · Dashboard customization
- · Download to CSV
- · Duration 180 days
- · Includes free plan features
- · Integration- Slack
Advance plan
- · Custom report - Up to 30
- · Dashboard customization
- · Download to CSV & Excel
- · Duration 365 days
- · Includes basic plan features
- · Integration Slack + upcoming
Plus plan
- · Dashboard customization
- · Download to CSV & Excel
- · Duration Lifetime
- · Integration Slack + upcoming
- · Unlimited Automation
- · Unlimited Custom report
Coverage counts what each App Store listing names. Every feature, checked off app by app, is in Shoplist.
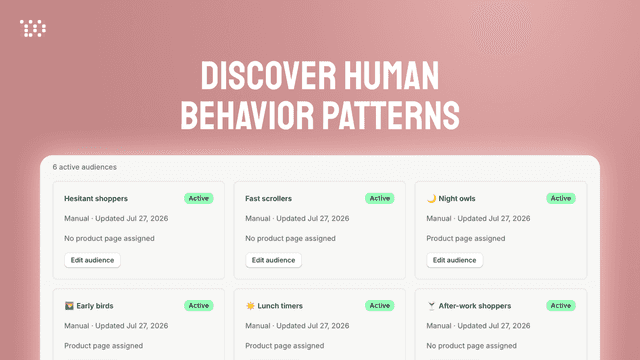
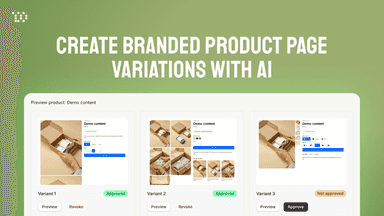
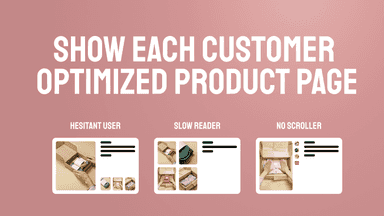
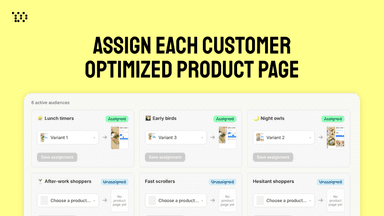
See every featureOptimize acquired traffic with adaptive product pages. Create on-brand product page variations with AI, automatically identify customer segments, and continuously run A/B tests for each audience. On autopilot.
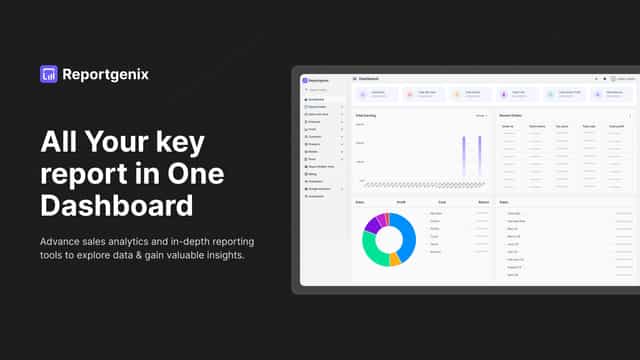
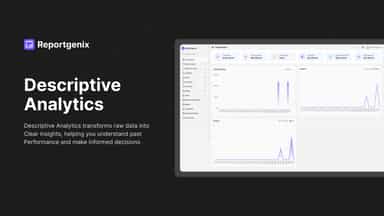
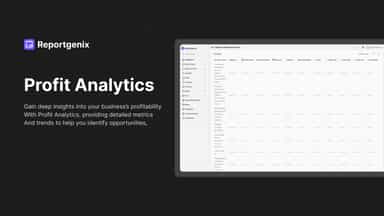
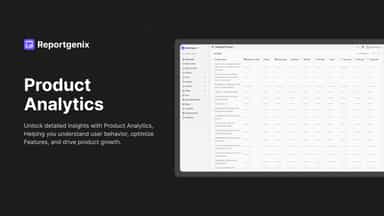
Make smarter decisions with AI-powered store analytics. Get 100+ ready-to-use reports for sales, customers, and inventory — no setup needed. Ask Genix AI questions and get reports in seconds. Build custom reports with your own columns, filters, and calculations. Track performance on interactive dashboards. Automate report delivery on your schedule.
- Generate on-brand product page versions with AI.
- Automatically identify customer audiences from shopping behavior.
- Personalize product pages for every customer.
- Track sales by day, week, month, product, & customer type for detailed insight.
- Drag & Drop Custom report, multi-Currency Reporting, and Multiple Chart option.
- Pre-made custom reports with scheduling & simple exports.
- AI-powered report & Automation of reporting schedules
All the numbers
Every figure, side by side
A green dot marks the app ahead on a measured figure. Estimates, gaps and apps that leave no storefront trace never take the lead.
Adoption
| Measure |  100 Rocks |  ReportGenix |
|---|---|---|
| Detected stores | Not published | Not published |
| Net store change, 28 days | 0 | 0 |
| Stores added, 28 days | Not enough data | Not enough data |
| Big-brand share | Not enough data | Not enough data |
| Top store categories | Not published | Not published |
| Top store countries | Not published | Not published |
Reviews
| Measure | 100 Rocks | ReportGenix |
|---|---|---|
| App Store rating | Not published | Not published |
| App Store reviews | Not published | Not published |
| New reviews, 28 days | Not enough data | Not enough data |
| Reviewers a year or more in | Not enough data | Not enough data |
Pricing
| Measure | 100 Rocks | ReportGenix |
|---|---|---|
| Free plan | Yes | Yes |
| Lowest paid monthly plan | $99/month | $19.99/month(ahead) |
| Longest free trial | Not listed | Not listed |
| Plans listed | 4 | 4 |
Listing
| Measure | 100 Rocks | ReportGenix |
|---|---|---|
| Shopify category rank | #1098 | Not enough data |
| Shopify App Charts | Not on this week’s charts | Not on this week’s charts |
| Built for Shopify | No | No |
| Launched | Aug 5, 2026 | Oct 16, 2024 |
| Languages | 1 | 1 |
| Developer | Karen Charykov | Appgenix |
FAQ
100 Rocks and ReportGenix: common questions
- Is 100 Rocks or ReportGenix cheaper?
- Both list a free plan. Paid plans start at $99/month for 100 Rocks and $19.99/month for ReportGenix. Shoplist compares base prices only between monthly plans in the same currency; usage charges and annual plans vary, so check each plan’s limits.
- What features does each app list that the other doesn’t?
- 100 Rocks lists 7 the others don’t mention, such as Activity tracking, AI insights, Broken links, Cohort analysis. ReportGenix lists 8 the others don’t mention, such as Custom reports, Data export, GDPR compliance, Notifications. A feature missing from a listing may still be supported; this compares what each App Store listing says.
- Where does this comparison’s data come from?
- Shoplist crawls Shopify storefronts to detect which apps each store runs, and reads each app’s Shopify App Store listing for reviews, pricing, features and integrations. Store counts are as of Oct 13, 2026 for 100 Rocks, Oct 19, 2026 for ReportGenix; estimated figures are labeled.
How Shoplist compares apps
Store counts come from Shoplist’s crawl of Shopify storefronts, which detects the apps each store runs; they are as of Oct 13, 2026 for 100 Rocks, Oct 19, 2026 for ReportGenix. Reviews, ratings, plans, features and integrations come from each app’s Shopify App Store listing. 28-day figures are labeled when estimated, and a figure that is missing or estimated never decides who leads. Read the methodology.