Detected May 15, 2026
Listing title changed +3 more
Listing title changed
Know what clicks actually bring sales with revenue-based heatmaps. Reduce abandoned sessions.Stop guessing which buttons work. Visualize conversions with heatmaps & session replays.
Description rewritten
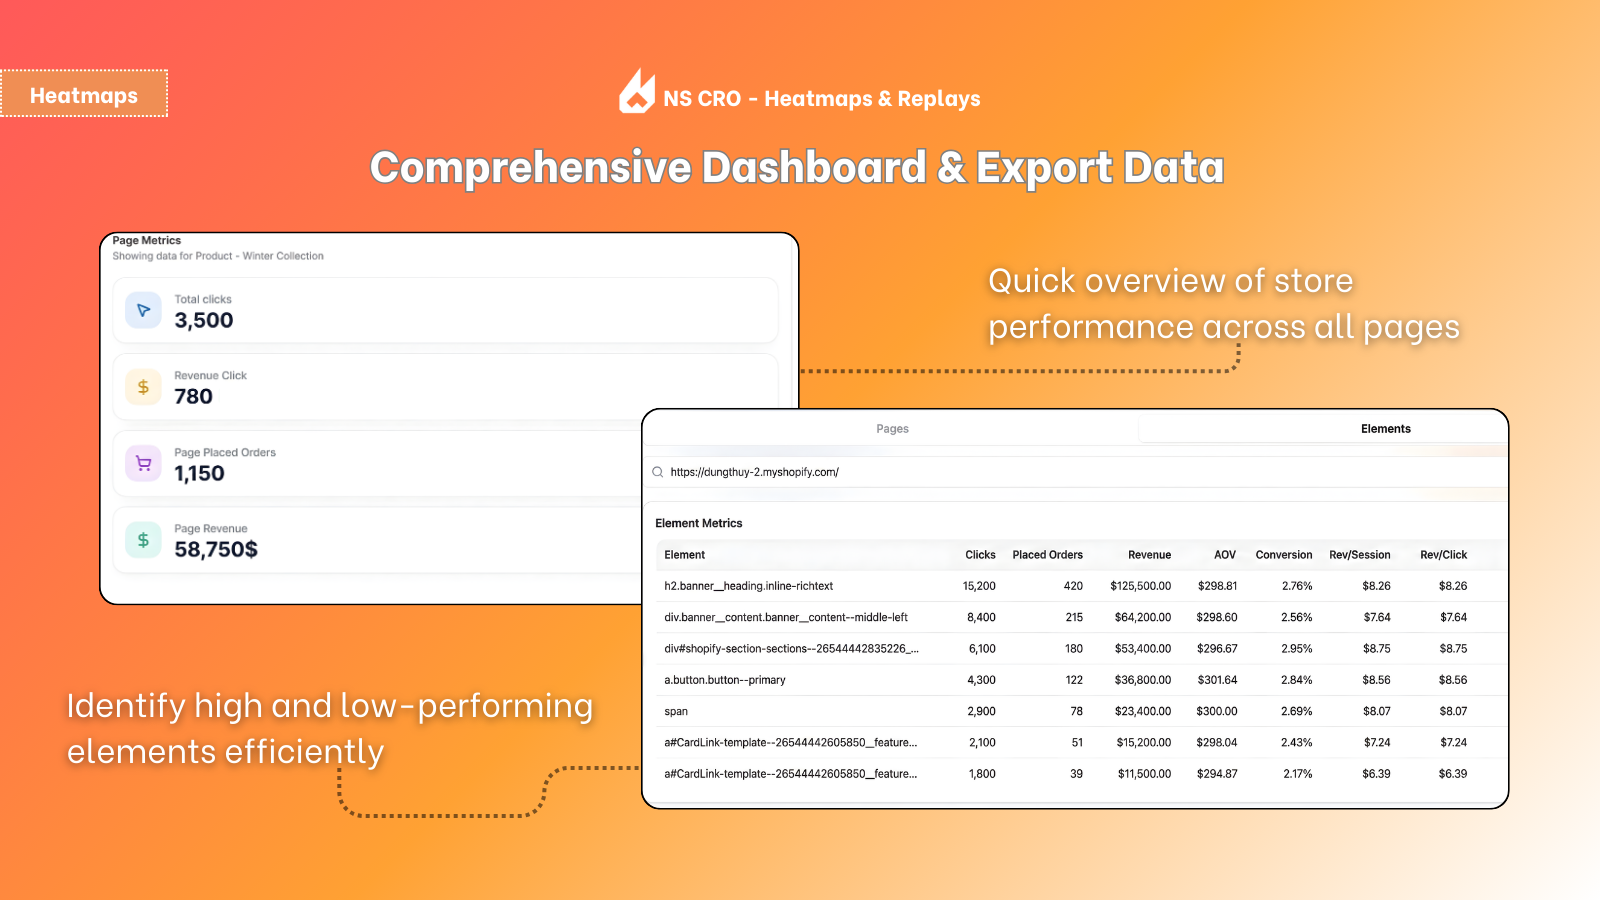
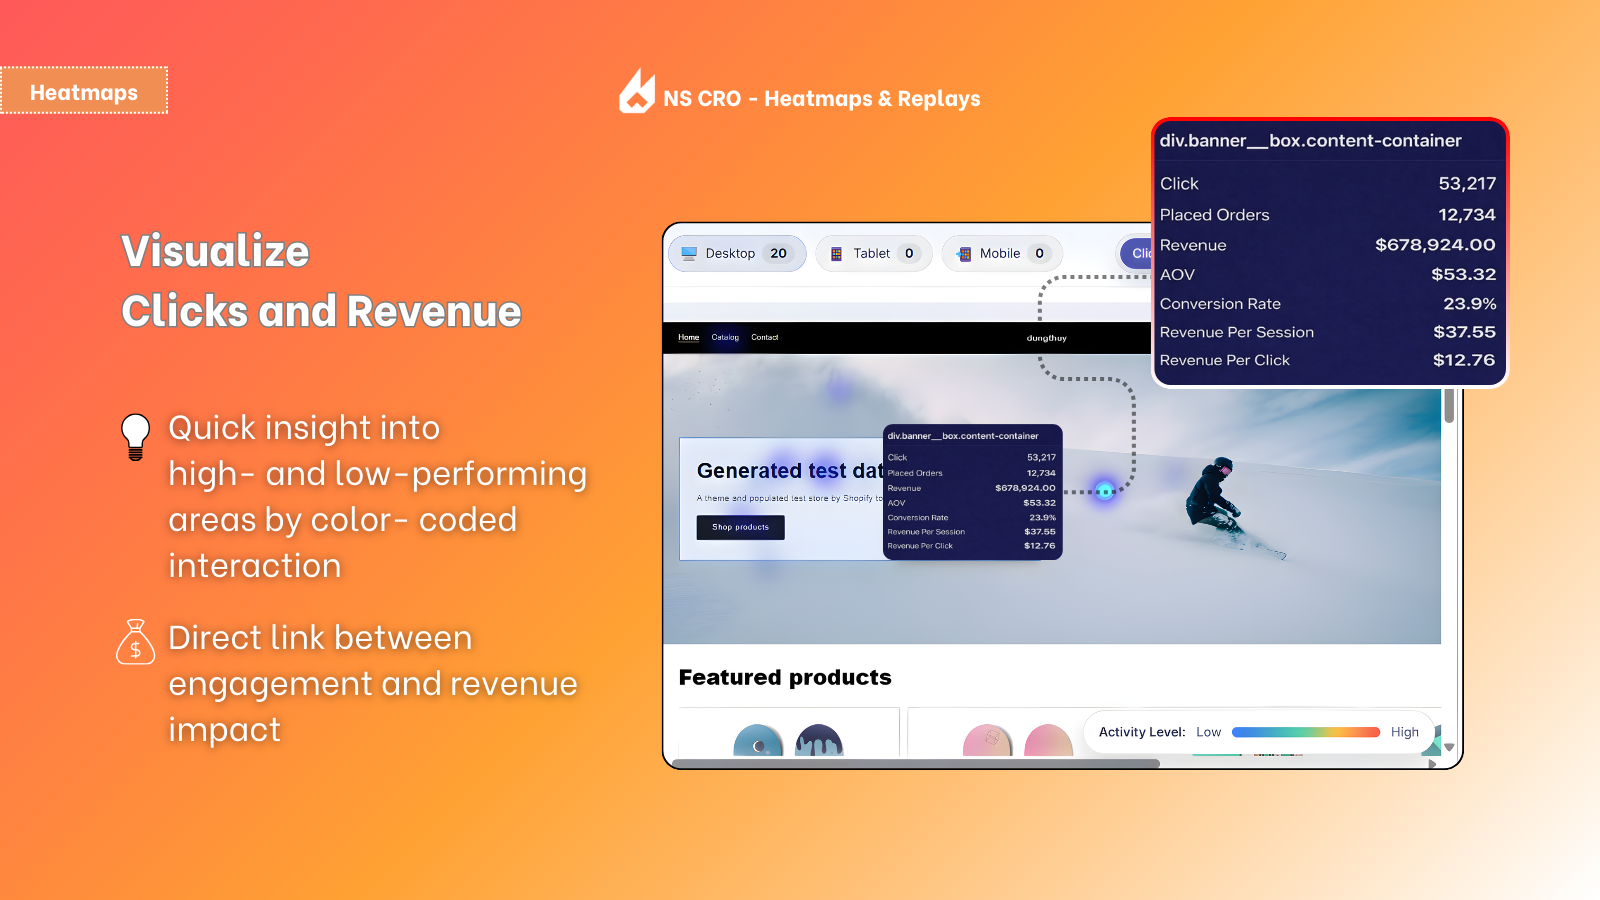
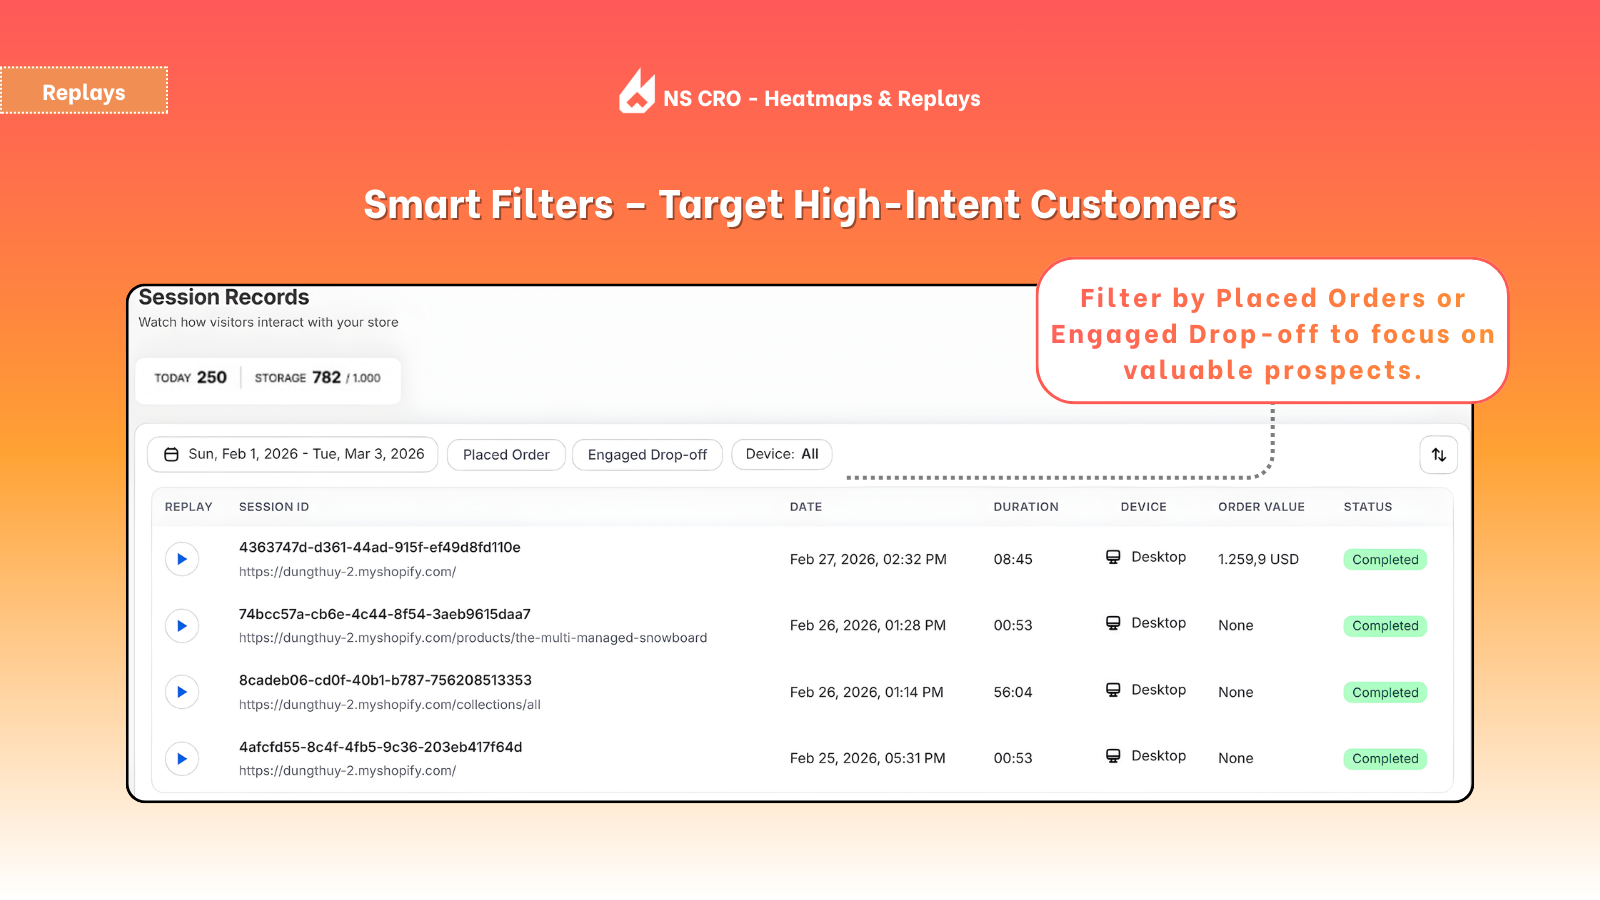
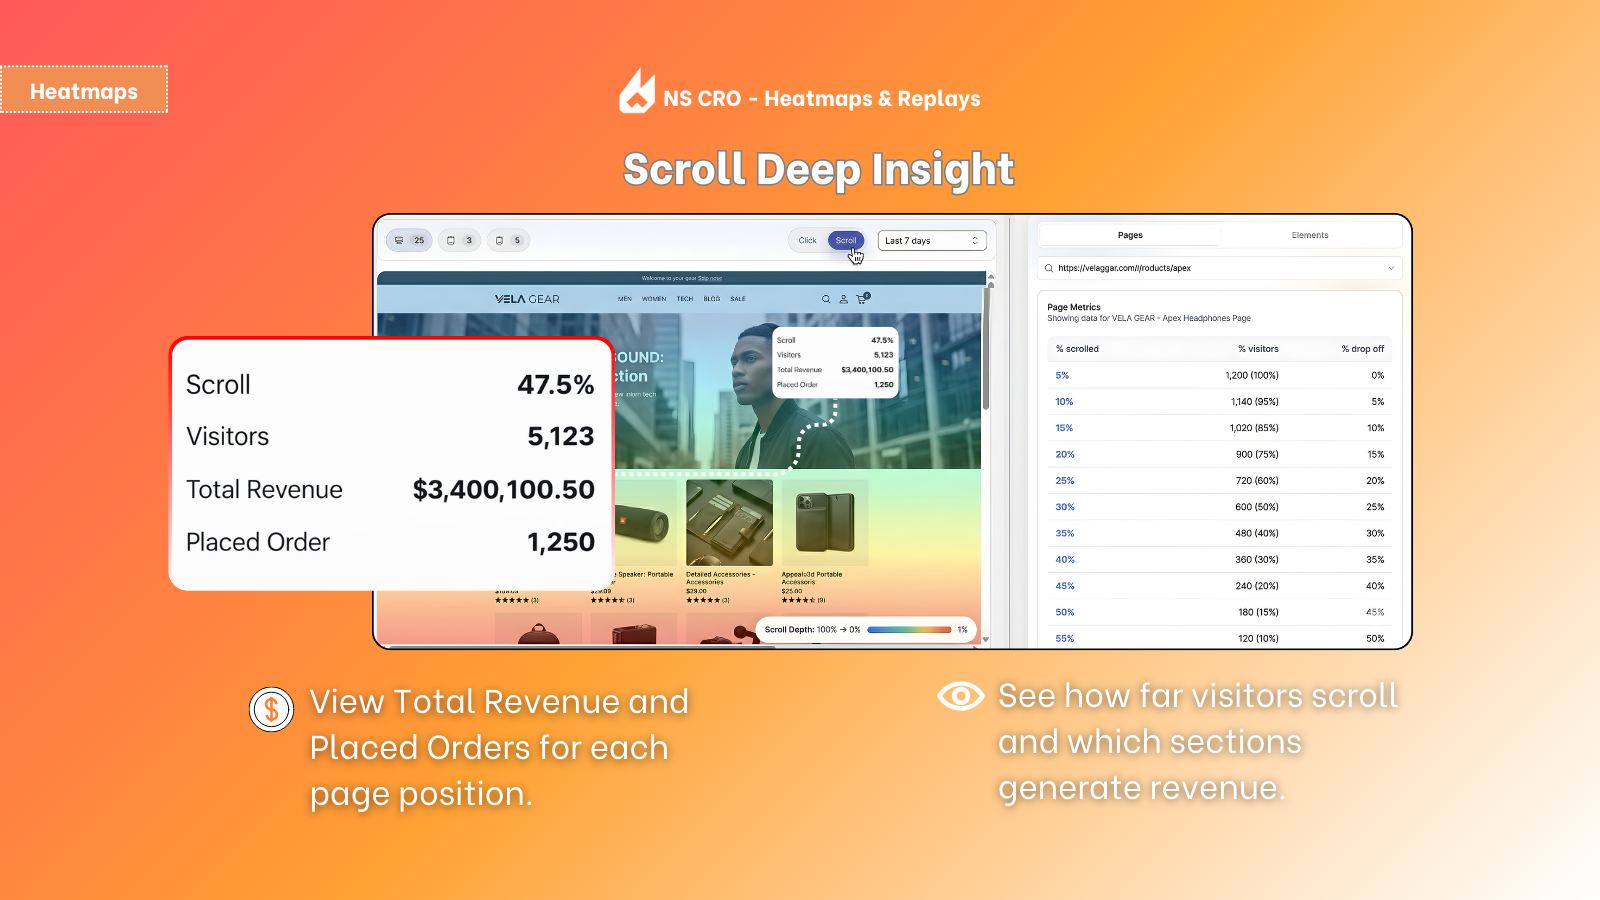
Understand how visitor behavior connects directly to revenue. Revenue-based heatmaps reveal NS Revenue Heatmap reveals click or and scroll activity, showing the financial impact behind every element. connect heatmaps with profitability metrics (sales generated, average order value, conversion rate). Session record helps records let you replay customer journeys to identify drop-off points and highlight key events such as add-to-cart "Add-to-cart" or checkout steps. A revenue "View product". An analytics dashboard delivers page-level metrics, helping you interpret behavioral data, refine UI/UX decisions, improve conversion quality, and strengthen customer retention.
Callouts updated
+1 more change in this update